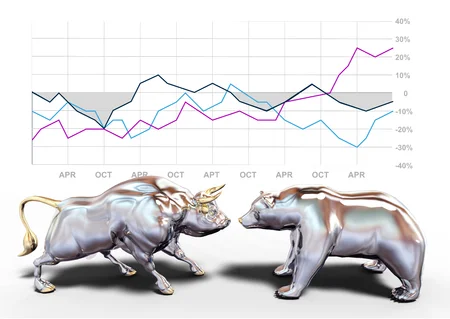
What are Bull and Bear Traps?
Beginner traders have the most trouble when they pick bad times to get into their positions. Many people have probably been in a situation where they looked at the chart and saw that the cryptocurrency was going up, so they bought it. Then the growth stopped, and the price went down....

Beginner traders have the most trouble when they pick bad times to get into their positions. Many people have probably been in a situation where they looked at the chart and saw that the cryptocurrency was going up, so they bought it. Then the growth stopped, and the price went down. When this happens, it seems like someone is following you and making the price move the opposite way on purpose. It’s not, though. There are patterns in how the market moves, and it’s important to know them so you can take less risk. The “bull trap” is one of the risky things that can happen on the market.
How Do Bull and Bear Traps Work?
A false move up in price is called a bull trap. Breaking through the resistance level is a key part of this process. Most of the time, when this happens, traders think that the movement can only go up from here, so they buy an asset at a higher price. But the bull trap doesn’t mean that the trend has changed. It just means that a lot of traders clicked the “buy” button at the same time, even though the general mood of the market didn’t change. So, the trader who bought it fell into a trap, because after the price went up, it went back to where it was before. For the trader to get out of this situation, he or she must either expect the price to go up or sell at a loss. If most traders still choose to sell, this could hurt the price and make it go down even more.
The opposite of the bull trap is the bear trap. This is the point in the market when the price goes down for a while, breaks through the support level, and then goes back to where it was. When this happens, many traders may think that the price will drop even more, so they may start selling their assets or even use leverage to open short positions.
Bull Trap Examples
To figure out what the bull trap is, you can look at the bitcoin charts from the last few months. With a sharp rise in the price of cryptocurrency and good news, many newcomers start to buy currency, trying to be the last person in the last car. This movement of the snowball adds movement. But what should happen next with the price? To move up, you need more people who are willing to buy at high levels. There should be more people who are willing to buy at high levels than people who want to sell and take profits. Most of the time, this doesn’t happen, and the price will usually go down after a flat (the moment of accumulation, when the price movement is between the support and resistance levels).
Example of a Bear Trap
You don’t have to look hard to find examples of bear traps. When you look at the price of bitcoin, it happens all the time. At this point, the support level has been broken, but the sellers don’t have enough power to push the price even lower. Because of this, the price stays flat for a while and then either goes back up or goes back to where it was. In this case, growth is mostly caused by traders who are trapped because they risk losing a lot of money because they have so many open short positions. To avoid this, they sell at a loss.
How Can a Trader Keep From Getting Caught in Traps?
The trader must first keep his cool so he doesn’t fall into the bull and bear traps. During a sharp price change in either direction, you can’t buy something quickly. During these times, there is a chance that you will buy at the best possible time and then lose money for a long time.
It’s important to note that it’s not hard to spot a bull trap, even though many traders will only say it was obvious after the fact. This is because after the price breaks through a resistance level, it usually goes up. But the rate of price growth on the charts is something to keep an eye on. If the price goes up quickly without any important news, it will probably go down quickly after a while as well. By the way, it’s often a good idea to open short positions at these times.
Pay attention to how much money has been bought and how much fear and greed there is. Most traders use the Relative Strength Index to tell if a stock has been overbought (RSI). And the index of fear and greed can be found on our page called “Index of fear and greed.”
Also, it is very important to set stop losses when you trade. When you open a long (buy) position, be sure to set a stop loss. With these kinds of moves, you can avoid big losses and open a new position going in the opposite direction.
